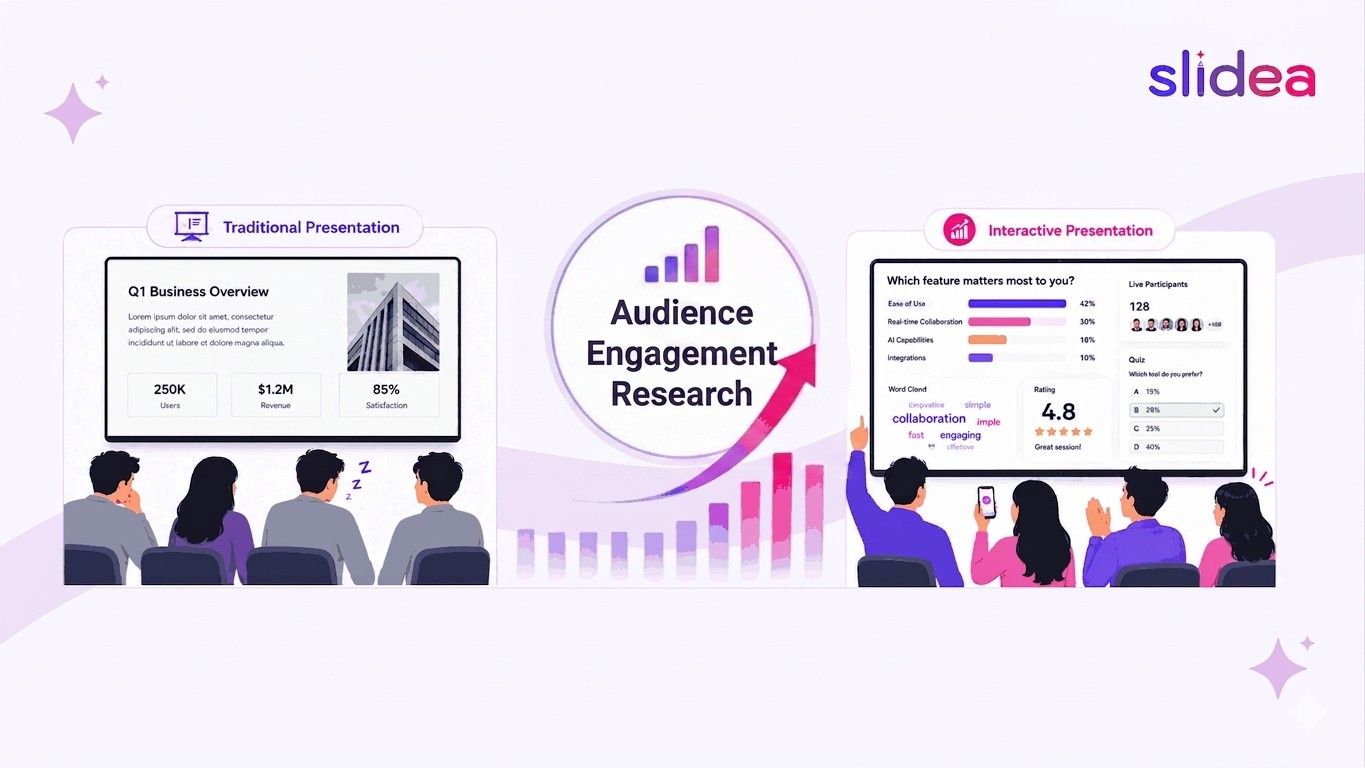
The research on interactive presentations points in one direction: passive presentations consistently underperform interactive ones across every measurable dimension. Active learning produces 54% better retention than passive lecture formats, with average test scores of 70% in active environments versus 45% in passive ones.
Key Statistics at a Glance
| Metric | Statistic | Source |
| Average attention span on one screen point | 47 seconds | Multiple independent sources |
| Optimal presentation length (audience preference) | 10 to 15 minutes | Multiple independent sources |
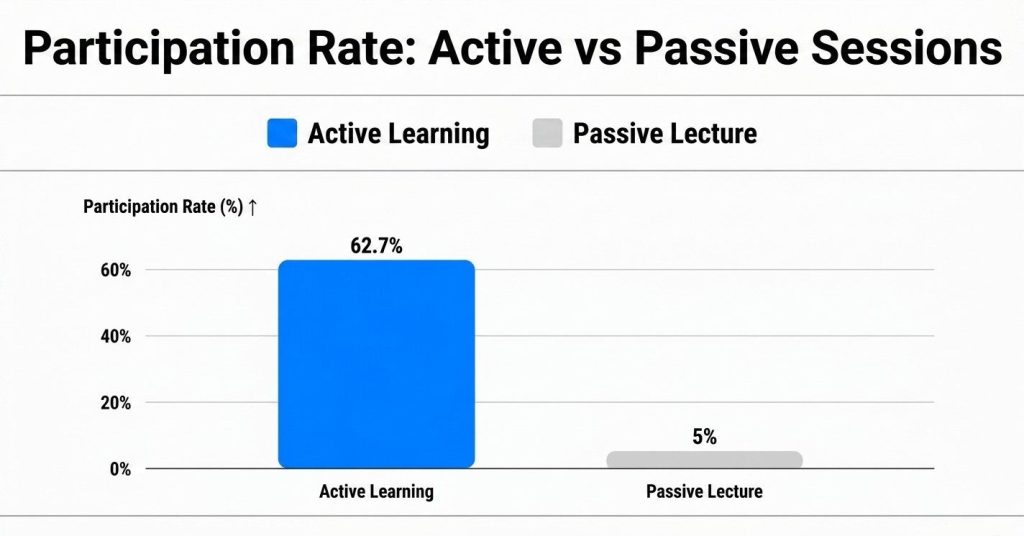
| Participation rate: active sessions | 62.7% | Active Learning Impact Study (2024) |
| Participation rate: passive sessions | 5% | Active Learning Impact Study (2024) |
| Retention improvement: active vs passive | 54% better | Active Learning Impact Study (2024) |
| Test scores: active learning | 70% average | Active Learning Impact Study (2024) |
| Test scores: passive learning | 45% average | Active Learning Impact Study (2024) |
| Marketers saying interactive content outperforms static | 70% | Multiple marketing research compilations 2026 |
| Educators saying engagement is critical to achievement | 93% | Discovery Education 2025 |
| Second-screen distraction during presentations | 33% in 2026, up from 20% in 2024 | 2026 presentations industry report |
The data on this page makes one consistent argument: passive presentations consistently underperform interactive ones. In a 2024 study examining thousands of learners, active learning sessions produced a 62.7% participation rate compared to just 5% in passive lecture formats. Retention improved by 54%. Test scores averaged 70% in active environments versus 45% in passive ones. These are not marginal differences.
This page compiles the most important statistics on interactive presentations, audience engagement, active learning, and audience participation for 2026. The focus is on participation rates, retention outcomes, and learning results — the metrics that matter most for anyone building a case for interactive sessions. Every statistic is sourced. The methodology is explained in the Sources section at the end.
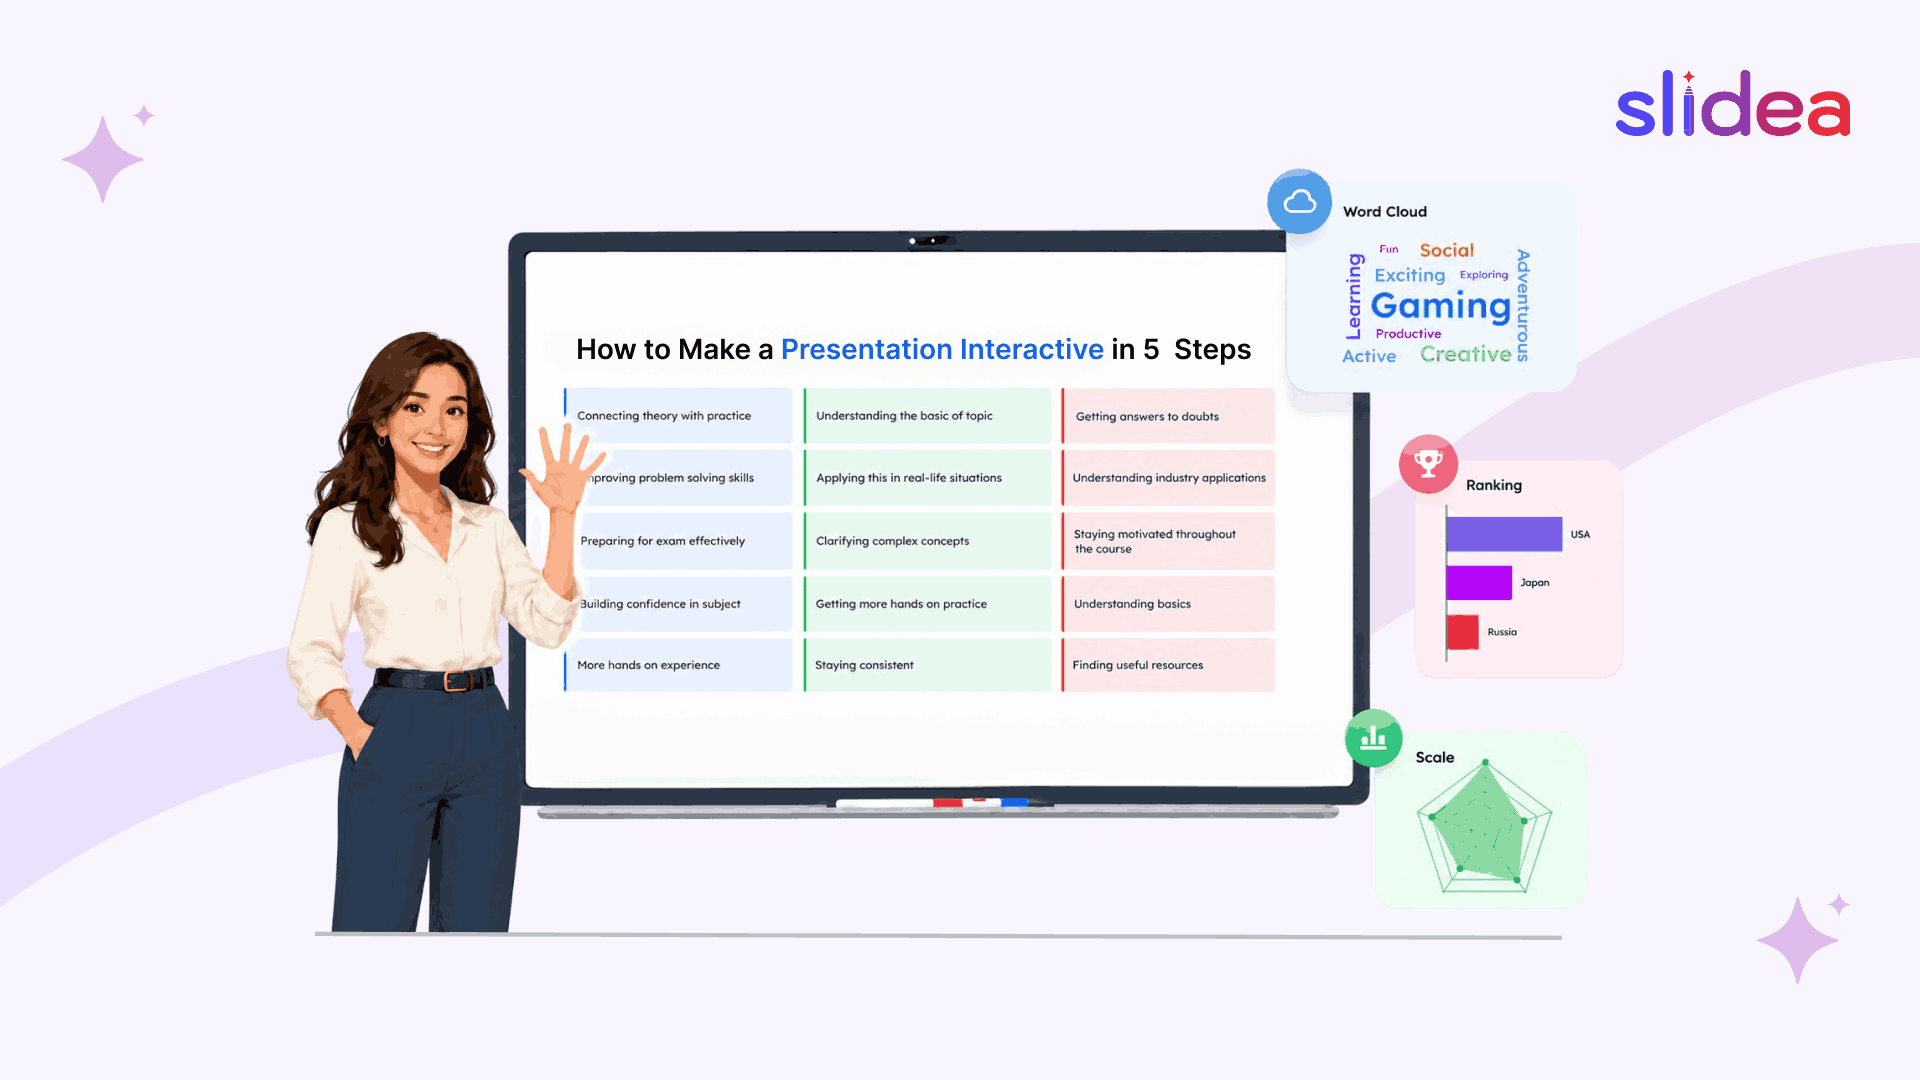
For a practical guide to applying these findings, read our complete guide to interactive presentations.
Audience Attention Statistics
The attention window is shorter than most presenters expect
Research consistently cited across presentation and learning studies puts the average attention span on a single point on screen at approximately 47 seconds before attention begins to drift. That is not the total time someone pays attention to a session. It is how long they remain focused on a single idea before their mind moves on.
Over 60% of audiences say the optimal presentation length is 10 to 15 minutes. Most audiences begin to disengage within 10 minutes of a standard lecture-style presentation starting.
Source: Multiple independent presentation research sources, 2025.
The second-screen problem is growing
According to a 2026 presentations industry report, second-screen distraction during presentations has risen from approximately 20% in 2024 to over 33% in 2026. That means one in three audience members is likely looking at another device during your presentation at any given moment.
Only 29% of B2B buyers are fully engaged during a typical sales presentation, according to the same report. 60% are described as indifferent and 11% are actively disengaged.
Source: 2026 presentations industry report. Note: industry publication, not peer-reviewed. Treat as directional.
What this means in practice
A 45-minute presentation without any audience participation is delivering content to a partially attentive room for most of its duration. Interactive elements at the 10 to 15 minute mark do not interrupt the session. They reset it, bringing the audience’s attention back to full before continuing.
Audience Participation Statistics: Active vs Passive
The strongest dataset on this topic comes from a 2024 active learning study involving thousands of learners across multiple virtual learning sessions. Key findings included:
Active learning sessions compared to passive lecture formats produced:
- 13 times more learner talk time
- 16 times higher rates of non-verbal engagement through polls, chat, and interactive tools
- A 62.7% participation rate in active sessions versus just 5% in passive lecture formats
That final comparison is the most practically significant. In a passive lecture setting, roughly 1 in 20 participants is actively engaging with the content at any given moment. In an active learning environment, roughly 6 in 10 are engaged simultaneously.
Source: Engageli Active Learning Impact Study, 2024. Peer-reviewed and published.
For presentation-specific contexts
Research suggests that when presenters do all the talking without interacting with their audience, engagement drops measurably. 70% of marketers say interactive content is more effective at engaging audiences than static or passive alternatives.
Source: Multiple marketing research compilations, 2026.
Retention Statistics: What Audiences Actually Remember
Participation rates matter, but retention is the outcome that counts. A 2024 active learning study found that active learning produced 54% better retention, with average test scores of 70% in active learning environments compared to 45% in passive settings.
Research published in March 2025 found that students exposed to active learning methodologies perform 1.5 times better on assessments compared to peers in traditional lecture formats. Interactive components such as quizzes and simulations were found to enhance recall rates significantly compared to lecture-only delivery.
Sources: Engageli Active Learning Impact Study 2024; MoldStud Research Team, March 2025.
The mechanism behind the numbers
The improvement in retention from interactive presentations is explained by a well-established cognitive science principle called the testing effect. When someone retrieves information by answering a question, such as a poll, a quiz question, or an open-ended prompt, they process it more deeply than when they simply hear it explained. This effect is one of the most replicated findings in cognitive psychology and applies equally to educational and corporate contexts.
A quiz question placed after a key concept does not just test whether the audience understood. It strengthens the memory trace for that concept regardless of whether the answer was correct.
Meeting and Webinar Engagement Statistics
The attention and participation problem is not limited to classrooms. It is equally present in corporate meetings and webinars.
Research consistently suggests that over 70% of business professionals report turning their attention away during presentations that lack engagement. In virtual meeting settings, where cameras may be off and a second screen is one click away, this figure is likely higher.
Source: Widely cited across multiple presentation research compilations. Treat as directional. Precise original source varies across literature.
Webinars are the second-fastest-growing B2B event type, with particularly strong adoption among midsized organisations. As webinar usage grows, the engagement challenge scales with it.
Source: Forrester B2B Event Survey, cited in Univid Webinar Statistics Report 2026.
93% of educators in a 2025 survey agreed that student engagement is a critical metric for understanding overall student achievement.
Source: Discovery Education Student Engagement Survey, 2025.
Education and Training Statistics
Student performance
Students exposed to active learning methodologies perform 1.5 times better on assessments compared to peers in traditional lecture formats, according to research published in March 2025.
The participation gap between active and passive educational environments is particularly pronounced in large group settings. In a lecture hall of 200 students, a verbal question receives responses from perhaps five to ten people. A live poll on their phones receives responses from the majority of the room simultaneously.
Corporate training
The same principles that produce better outcomes in educational settings apply directly to corporate training. A quiz question every 10 to 15 minutes in a training session reinforces learning through active recall. Post-session analytics from interactive training consistently reveal which questions produced the most wrong answers, giving trainers actionable intelligence that passive training formats simply cannot provide.
The Attention Reset Effect
One of the most practically useful findings in presentation research is what happens when an interactive element appears mid-session.
When a poll or quiz question appears at the 10 to 15 minute mark of a presentation, audience attention resets. Members who were mentally elsewhere re-engage with the session. Each interactive moment effectively restarts the attention clock.
A presentation structured with an opening interaction, one or two mid-session resets, and a closing activity addresses the natural attention curve directly. The audience’s effective engagement across a 45-minute session with three well-placed interactions is substantially higher than across a 45-minute uninterrupted lecture.
What the Data Says About Frequency
How often should interactive elements appear? The research points to a consistent answer.
Attention begins to drift within the first 10 minutes. An interactive element every 10 to 15 minutes maintains engagement across the full session. For a 30-minute presentation, that means two to three interactions. For a 60-minute session, four to five.
More than one interaction every eight minutes starts to feel disruptive. Fewer than one every 15 minutes and significant audience attention is lost between resets. The evidence-based target is one interactive element every 10 to 12 minutes.
Want to add polls, quizzes, word clouds and Q&A at exactly the moments these studies recommend? Try Slidea’s free interactive presentation builder, no credit card required.
Slidea in Practice: Real Session Data
The statistics above come from third-party research. The data below comes from real sessions run using Slidea.
Large-scale college technology event (March 2026)
At a college technology event in March 2026, 158 out of 170 teams actively participated in every interactive question throughout the session, representing a 93% participation rate across a large multi-team audience. Participants responded to every poll and interactive question without a prolonged drop in engagement during the session.
The results suggest that interactive formats can maintain high participation levels even in large audience settings. Despite the scale of the event, more than 9 in 10 teams remained active participants throughout the session.
Strategy meeting
In a strategy meeting using open-ended questions and word clouds, 100% of participants responded to every interaction. Every stakeholder’s perspective was captured in writing before the verbal discussion began.
The open-ended responses surfaced views from quieter participants that might otherwise have been missed in a traditional verbal discussion. The word cloud created a shared visual reference of the group’s collective priorities that shaped the meeting’s direction from the first slide.
Community gathering
In a community gathering using icebreaker word clouds and This or That questions, participation began immediately from the first slide. The interactive format reduced the slow warm-up period typical of large gatherings and created a shared experience from the opening minutes of the session.
Source: All three examples are drawn from real sessions conducted using Slidea in 2026. Participation data and observations are based on session analytics and facilitator records.
Frequently Asked Questions
What percentage of people disengage from non-interactive presentations?
Research consistently suggests that a significant majority of business professionals, commonly cited as over 70%, report turning their attention away during presentations that lack engagement. In virtual settings, this figure is likely higher. The most rigorous data point comes from a large 2024 active learning study showing a 5% active participation rate in passive lecture settings.
How much better is active learning than passive learning?
A 2024 active learning study conducted across thousands of learners found that active learning produced 54% better retention, with average test scores of 70% in active environments versus 45% in passive ones.
How often should interactive elements appear in a presentation?
The research on attention spans supports one interaction every 10 to 15 minutes, coinciding with the natural attention dip most audiences experience. For a 30-minute session, aim for two to three. For a 60-minute session, four to five.
Are these statistics applicable to corporate presentations as well as education?
Yes. While much of the research cited on this page was conducted in educational settings, the cognitive mechanisms, including active recall, attention resets, participation rates, apply equally to corporate meetings, training sessions, webinars, and events. The Slidea real session data above includes both educational and corporate examples.
Where can I find interactive presentation templates to put this into practice?
Browse interactive presentation templates on Slidea organised by audience type including education, training, meetings, and events. Each template has interactive slide types pre-built at the right moments based on the frequency guidance above.
Sources and Methodology
How statistics were selected for this page
Every statistic on this page was evaluated against three criteria before inclusion. First, traceability: the statistic needed to be traceable to a named study, publication, or research body. Statistics circulating widely online without a clear original source were excluded or flagged as directional only. Second, relevance: statistics needed to relate directly to live presentation engagement rather than general content marketing. Third, recency: priority was given to research published in 2024, 2025, or 2026.
Primary sources used on this page
- Active Learning Impact Study (2024). Conducted by Engageli’s Learning and Teaching team in a virtual classroom environment. The study compared different levels of active learning and measured learner talk time, non-verbal engagement, participation rates, and test score outcomes.
- Discovery Education Student Engagement Survey, 2025. Covers educator attitudes toward student engagement as a learning outcome metric.
- MoldStud Research Team, March 2025. Published findings on active vs passive learning performance outcomes. Covers assessment performance and recall enhancement from interactive components.
- Forrester B2B Event Survey, 2026. Covers webinar growth and adoption trends among B2B organisations. Referenced in Univid Webinar Statistics Report 2026.
- Multiple independent presentation research compilations, 2025 to 2026. Used for attention span and presentation length preference data. Original primary sources vary across compilations. Treated as directional.
- 2026 presentations industry report. Covers second-screen distraction trends and B2B buyer engagement during sales presentations. Industry publication, not peer-reviewed. Treated as directional.
- Slidea real session data. The three session examples in the Slidea in Practice section are drawn from real sessions conducted using Slidea in 2026. Participation figures are based on session analytics data. Sessions are described without identifying the specific organisations involved.

Leave a Comment
Your email address will not be published. Required fields are marked *