Analyse your audience enhancement with our presentation analytics method
Gain presentation insights into to know about the effectiveness of your meetings. And, you can easily share these results with your team any time.
GET STARTED
See how many people have answered your quiz
With the scores and rankings in your hand, you can easily analyze your audience’s engagement ratio during your meeting. This helps you to improve your upcoming events and meetings in a better way.
Track analytics now
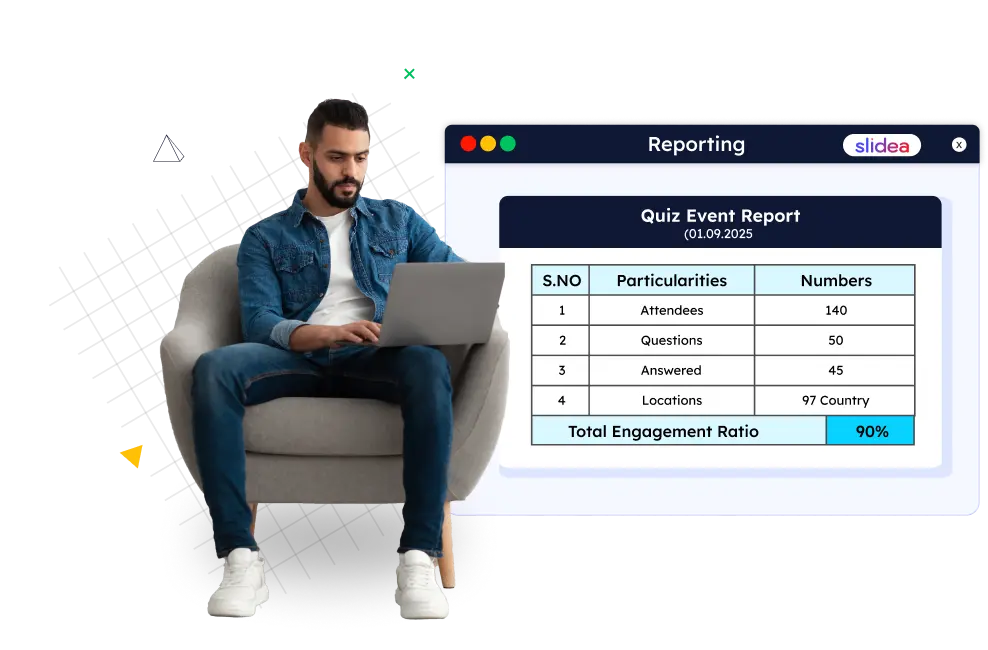
Prepare a customized report about your events
You can generate a custom report, share it with your team and analyze the report to better serve the participants.
Explore nowQuickly share the results as images
Once the analytics are ready with results, you can share them as images and other supported formats. Better visibility, better engagement!
Create now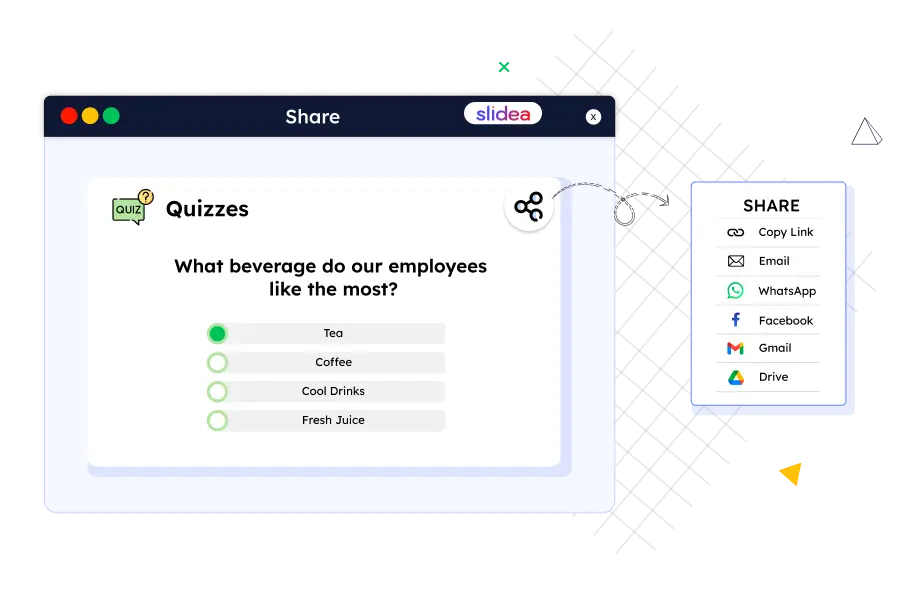
Additional features you will surely enjoy

Account Analytics

Export Results

Multiple Events Track


Frequently Asked Questions
It allows presenters to gain insights into audience engagement during meetings and events by tracking responses, scores, and participation in real time.
You can see how many people answered your quizzes, view scores and rankings, and analyze the engagement ratio directly from the analytics dashboard.
Slidea prepares customized reports about your events, which can then be shared with your team for further analysis.