Slidea provides a built-in Results View that allows presenters to review participant responses and engagement from interactive slides. Once a live session is completed, all results are saved and can be accessed directly from the presentation workspace for review and analysis.
Method: View Results After the Live Session
After a live session ends, participant responses are automatically collected and organized.
Steps to View Results
- Open your presentation in Slidea.
- Click Result from the top toolbar.
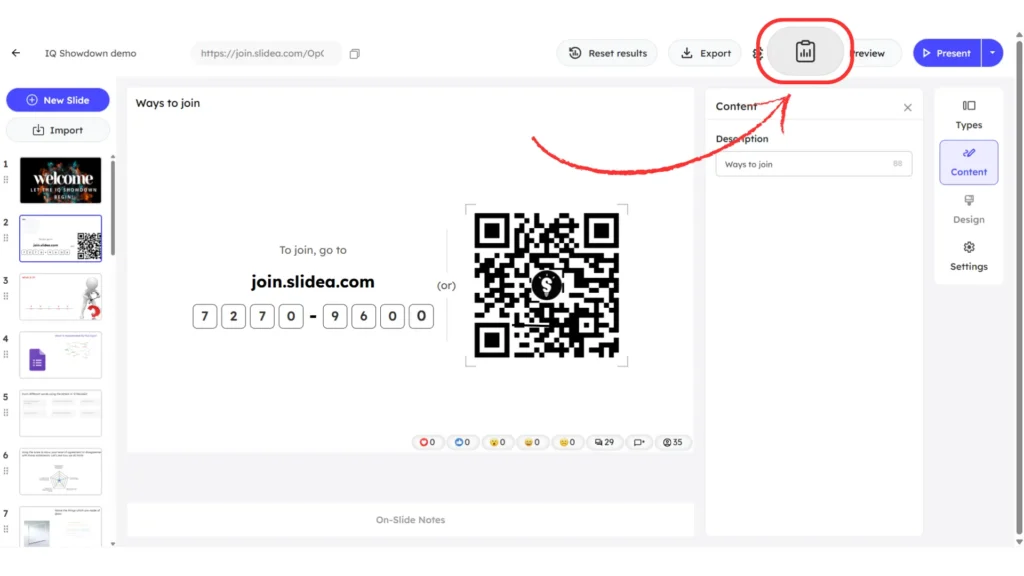
- Use the available tabs to review:
- Summary – overall participation, quiz performance, and Q&A activity.
- Response – detailed, slide-by-slide participant answers.
- Summary – overall participation, quiz performance, and Q&A activity.
- Use the Spreadsheet (XLSX) option to export results if needed.
Summary of Session Participation and Performance
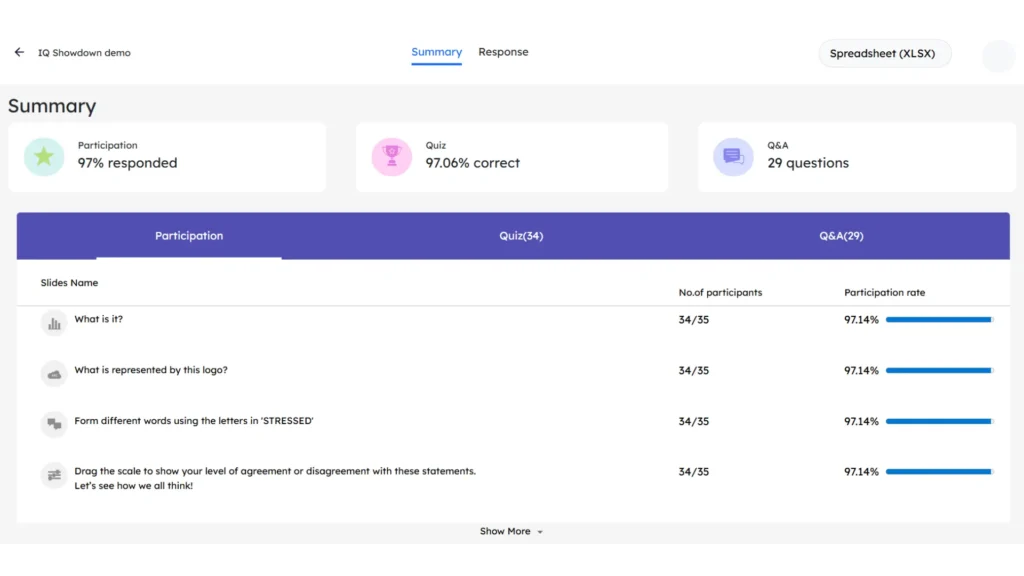
The Summary tab provides a high-level snapshot of audience engagement and performance across the entire session. It helps presenters quickly understand how actively participants interacted with the slides.
The Summary view displays:
- Participation rate, showing how many participants responded to the interactive slides
- Quiz performance, indicating overall answer correctness
- Q&A activity, showing whether audience questions were submitted during the session
Reviewing Slide-by-Slide Participant Responses
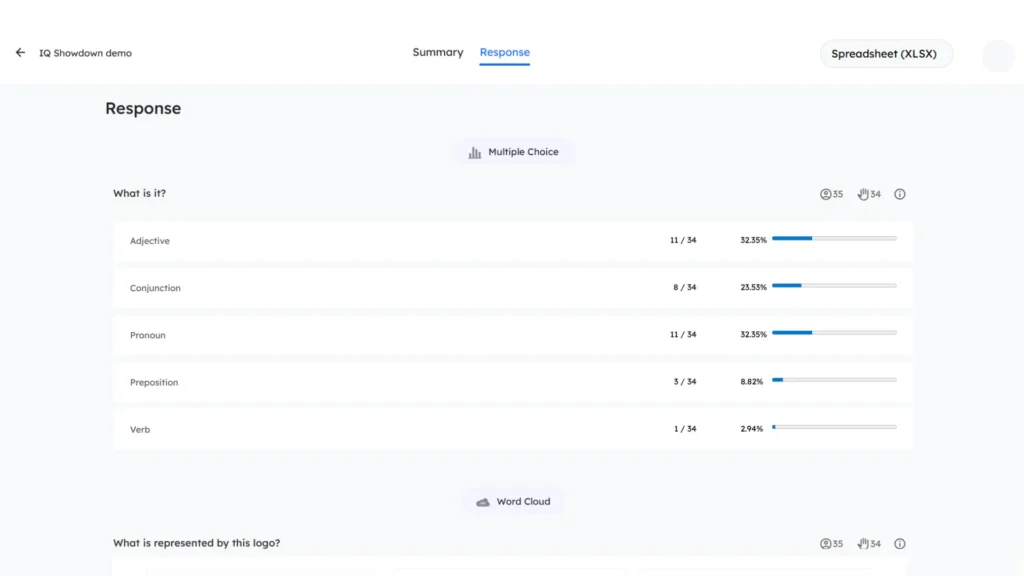
The Response tab displays participant answers for each interactive slide, focusing on individual submissions rather than overall session metrics. Results are organized slide by slide based on the interaction type.
This view allows presenters to:
- Analyze individual answers in detail
- Understand participant choices and response patterns
- Review response accuracy for quizzes and knowledge checks
Each interaction type presents responses in a clear visual format, making it easy to interpret results and assess audience understanding.
Why the Results View Is Useful
The Slidea Results View helps presenters:
- Review overall audience engagement and participation levels
- Analyze response patterns and answer accuracy across slides
- Identify slides with low or no participation
- Understand audience preferences, opinions, and sentiment
- Evaluate quiz performance and knowledge retention
- Improve future session design based on participation insights
- Share clear outcomes and reports with stakeholders using exported data
Leave a Comment
Your email address will not be published. Required fields are marked *